Android pie chart
An Android chart library that can be customized to a high degree.
Scroll below for examples.
Getting started
build.gradle[.kts]
copy
implementation("ir.mahozad.android:pie-chart:<version>")XML layout
copy
<ir.mahozad.android.PieChart
    android:id="@+id/pieChart"
    android:layout_width="wrap_content"
    android:layout_height="wrap_content" />
Kotlin activity
copy
val pieChart = findViewById<PieChart>(R.id.pieChart)
pieChart.slices = listOf(
    PieChart.Slice(0.2f, Color.BLUE),
    PieChart.Slice(0.4f, Color.MAGENTA),
    PieChart.Slice(0.3f, Color.YELLOW),
    PieChart.Slice(0.1f, Color.CYAN)
)
Jetpack Compose
copy
@Composable
fun PieChartView() {
    AndroidView(
        modifier = Modifier.fillMaxSize(),
        factory = { context ->
            PieChart(context).apply {
                slices = listOf(
                    PieChart.Slice(0.2f, Color.BLUE),
                    PieChart.Slice(0.4f, Color.MAGENTA),
                    PieChart.Slice(0.3f, Color.YELLOW),
                    PieChart.Slice(0.1f, Color.CYAN)
                )
            }
        },
        update = { view ->
            // View's been inflated or state read in this block has been updated
            // Add logic here if necessary
        }
    )
}
Examples
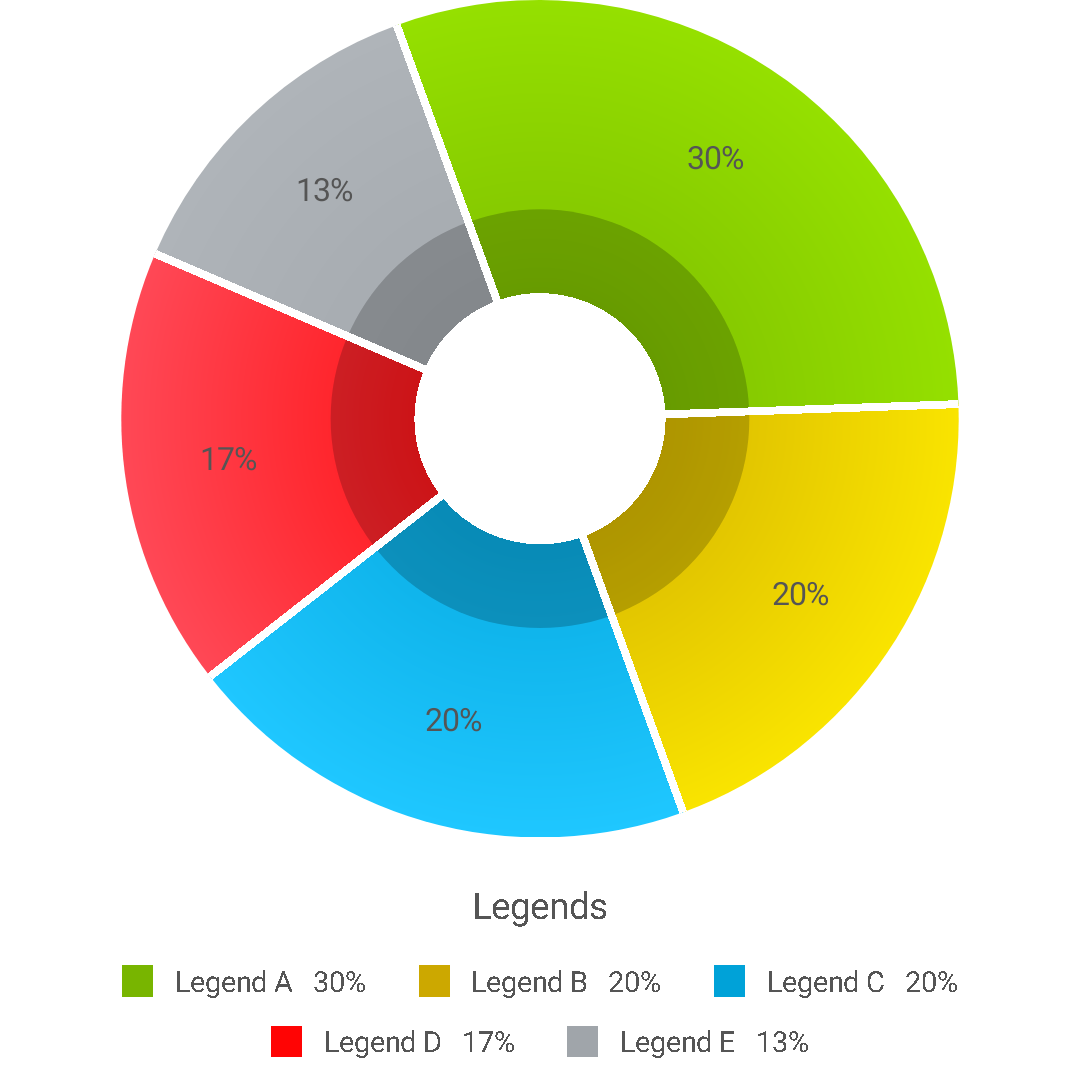
1 A classic donut chart
copy
pieChart.apply {
slices = listOf(
Slice(0.3f, Color.rgb(120, 181, 0), Color.rgb(149, 224, 0), legend = "Legend A"),
Slice(0.2f, Color.rgb(204, 168, 0), Color.rgb(249, 228, 0), legend = "Legend B"),
Slice(0.2f, Color.rgb(0, 162, 216), Color.rgb(31, 199, 255), legend = "Legend C"),
Slice(0.17f, Color.rgb(255, 4, 4), Color.rgb(255, 72, 86), legend = "Legend D"),
Slice(0.13f, Color.rgb(160, 165, 170), Color.rgb(175, 180, 185), legend = "Legend E")
)
gradientType = PieChart.GradientType.RADIAL
legendIconsMargin = 8.dp
legendTitleMargin = 14.dp
legendLinesMargin = 10.dp
legendsMargin = 20.dp
legendsPercentageMargin = 8.dp
legendsSize = 11.sp
legendsPercentageSize = 11.sp
legendsIcon = PieChart.DefaultIcons.SQUARE
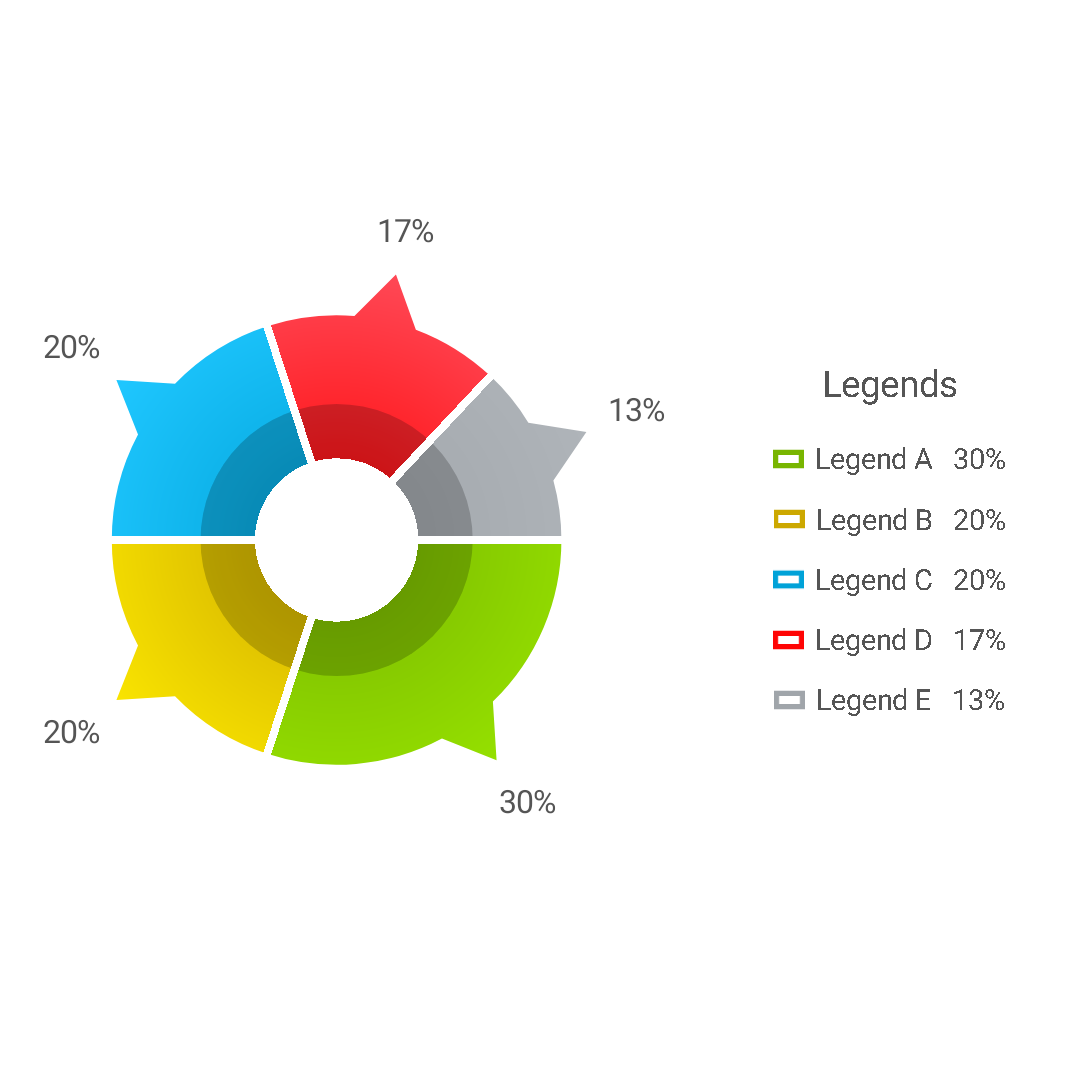
}2 A donut chart with pointers
copy
pieChart.apply {
slices = listOf(
Slice(0.3f, Color.rgb(120, 181, 0), Color.rgb(149, 224, 0), legend = "Legend A"),
Slice(0.2f, Color.rgb(204, 168, 0), Color.rgb(249, 228, 0), legend = "Legend B"),
Slice(0.2f, Color.rgb(0, 162, 216), Color.rgb(31, 199, 255), legend = "Legend C"),
Slice(0.17f, Color.rgb(255, 4, 4), Color.rgb(255, 72, 86), legend = "Legend D"),
Slice(0.13f, Color.rgb(160, 165, 170), Color.rgb(175, 180, 185), legend = "Legend E")
)
startAngle = 0
labelType = PieChart.LabelType.OUTSIDE
slicesPointer = PieChart.SlicePointer(18.dp, 24.dp, 0)
outsideLabelsMargin = 8.dp
gradientType = PieChart.GradientType.RADIAL
legendPosition = PieChart.LegendPosition.END
legendBoxBorder = 2.dp
legendBoxBorderCornerRadius = 8.dp
legendTitleMargin = 14.dp
legendLinesMargin = 10.dp
legendsMargin = 20.dp
legendsPercentageMargin = 8.dp
legendsSize = 11.sp
legendsPercentageSize = 11.sp
legendsIcon = PieChart.DefaultIcons.RECTANGLE_HALLOW
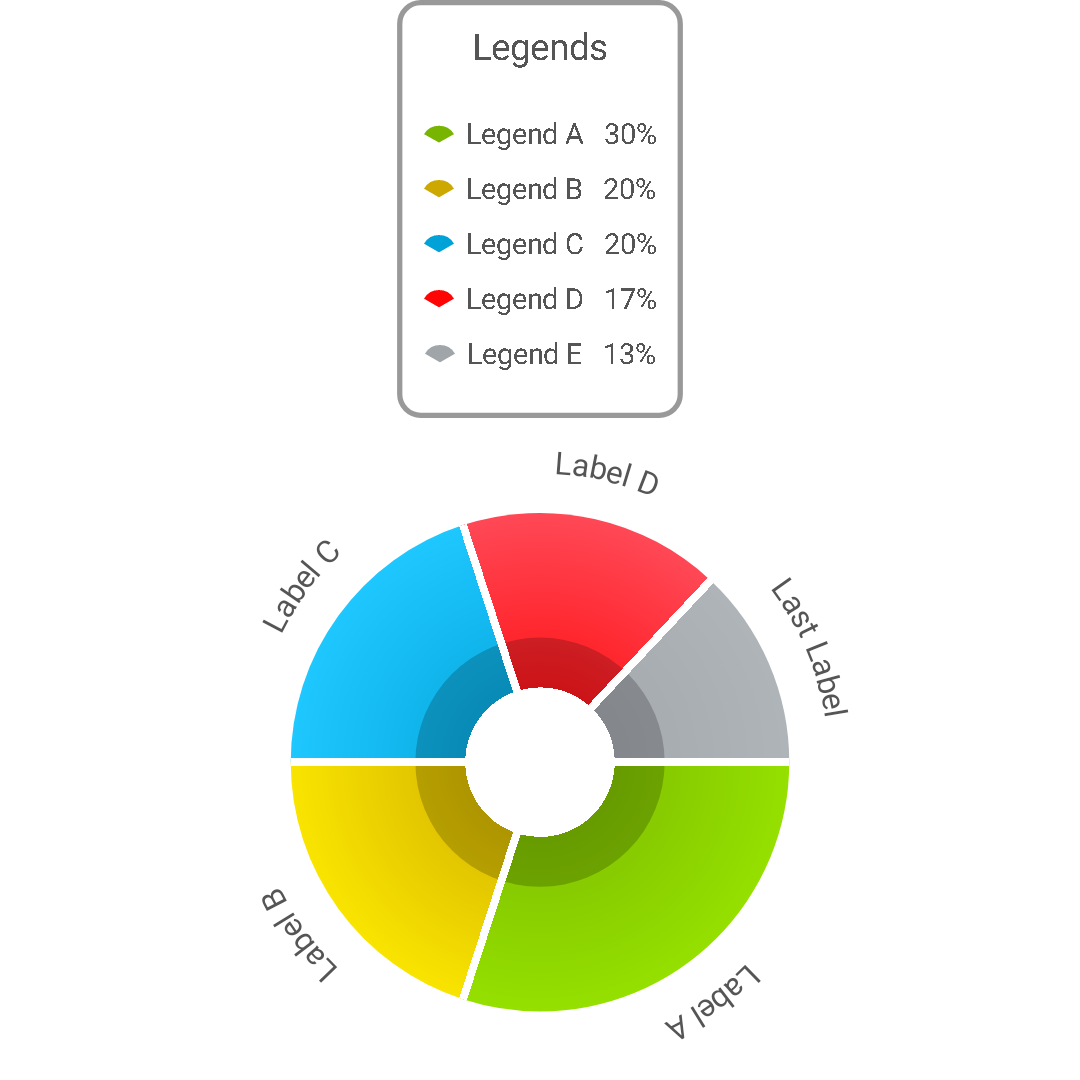
}3 A donut chart with circular labels
copy
pieChart.apply {
slices = listOf(
Slice(0.3f, Color.rgb(120, 181, 0), Color.rgb(149, 224, 0), legend = "Legend A", label = "Label A"),
Slice(0.2f, Color.rgb(204, 168, 0), Color.rgb(249, 228, 0), legend = "Legend B", label = "Label B"),
Slice(0.2f, Color.rgb(0, 162, 216), Color.rgb(31, 199, 255), legend = "Legend C", label = "Label C"),
Slice(0.17f, Color.rgb(255, 4, 4), Color.rgb(255, 72, 86), legend = "Legend D", label = "Label D"),
Slice(0.13f, Color.rgb(160, 165, 170), Color.rgb(175, 180, 185), legend = "Legend E", label = "Last Label")
)
startAngle = 0
labelType = PieChart.LabelType.OUTSIDE_CIRCULAR_INWARD
labelIconsPlacement = PieChart.IconPlacement.START
gradientType = PieChart.GradientType.RADIAL
legendPosition = PieChart.LegendPosition.TOP
legendArrangement = PieChart.LegendArrangement.VERTICAL
legendsWrapping = Wrapping.CLIP
isLegendBoxBorderEnabled = true
legendBoxBorder = 2.dp
legendBoxBorderCornerRadius = 8.dp
legendTitleMargin = 10.dp
legendsMargin = 8.dp
legendsPercentageMargin = 8.dp
legendsSize = 11.sp
legendsPercentageSize = 11.sp
legendsIcon = PieChart.DefaultIcons.SLICE2
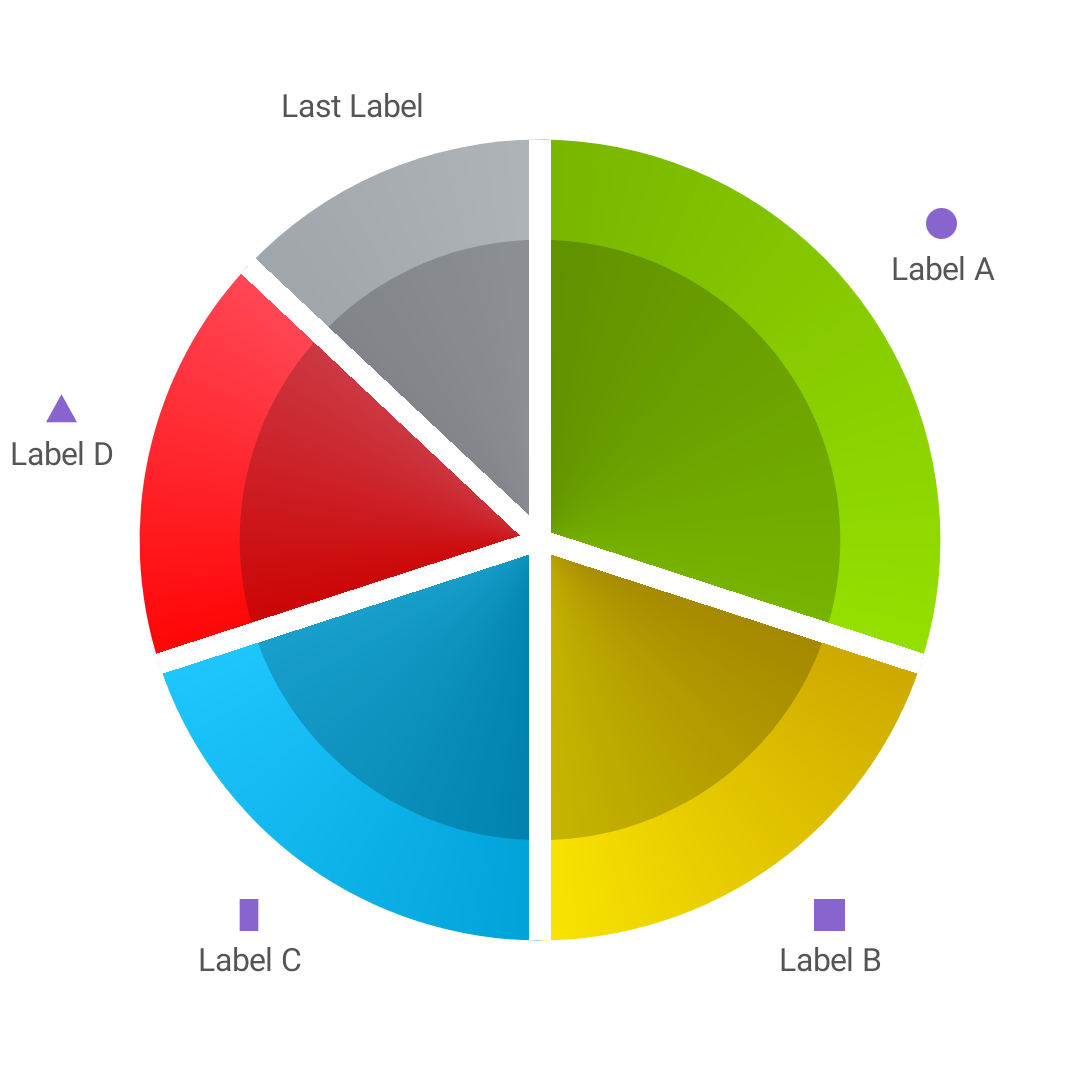
}4 A classic pie chart
copy
pieChart.apply {
    slices = listOf(
        Slice(0.3f, Color.rgb(120, 181, 0), Color.rgb(149, 224, 0), legend = "Legend A", label = "Label A", labelIcon = R.drawable.ic_circle),
        Slice(0.2f, Color.rgb(204, 168, 0), Color.rgb(249, 228, 0), legend = "Legend B", label = "Label B", labelIcon = R.drawable.ic_square),
        Slice(0.2f, Color.rgb(0, 162, 216), Color.rgb(31, 199, 255), legend = "Legend C", label = "Label C", labelIcon = R.drawable.ic_rectangle_tall),
        Slice(0.17f, Color.rgb(255, 4, 4), Color.rgb(255, 72, 86), legend = "Legend D", label = "Label D", labelIcon = R.drawable.ic_triangle),
        Slice(0.13f, Color.rgb(160, 165, 170), Color.rgb(175, 180, 185), legend = "Legend E", label = "Last Label")
    )
    labelIconsTint = Color.rgb(136, 101, 206)
    startAngle = -90
    isLegendEnabled = false
    labelType = PieChart.LabelType.OUTSIDE
    labelIconsPlacement = PieChart.IconPlacement.TOP
    gradientType = PieChart.GradientType.SWEEP
    holeRatio = 0f
    overlayRatio = 0.75f
    gap = 8.dp
}
5 A ring chart
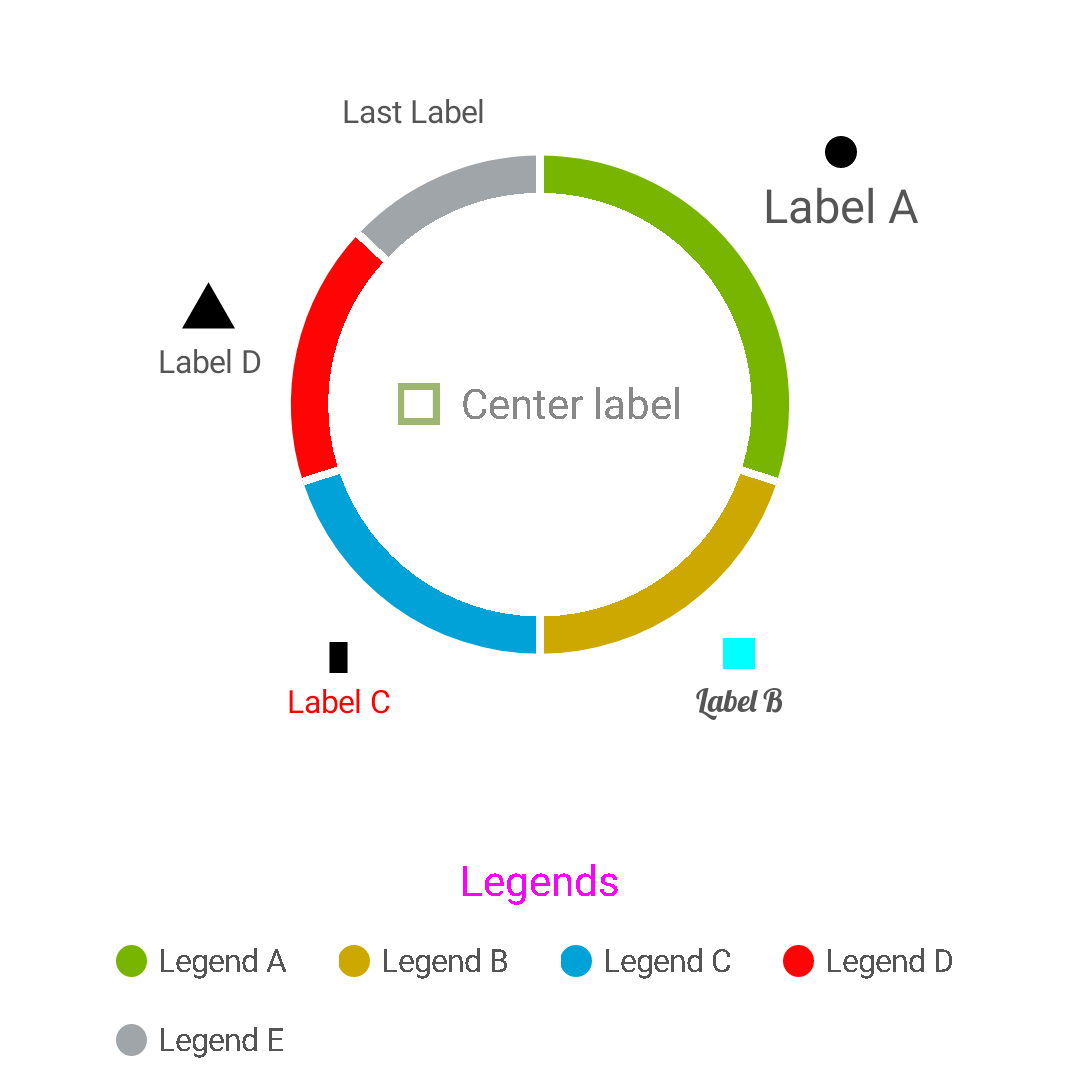
copy
pieChart.apply {
    val customFont = context.resources.getFont(R.font.myCustomFont)
    slices = listOf(
        Slice(0.3f, Color.rgb(120, 181, 0), legend = "Legend A", label = "Label A", labelIcon = R.drawable.ic_circle, labelSize = 18.dp.px),
        Slice(0.2f, Color.rgb(204, 168, 0), legend = "Legend B", label = "Label B", labelIcon = R.drawable.ic_square, labelIconTint = Color.CYAN, labelFont = customFont),
        Slice(0.2f, Color.rgb(0, 162, 216), legend = "Legend C", label = "Label C", labelIcon = R.drawable.ic_rectangle_tall, labelColor = Color.RED),
        Slice(0.17f, Color.rgb(255, 4, 4), legend = "Legend D", label = "Label D", labelIcon = R.drawable.ic_triangle, labelIconHeight = 20.dp.px),
        Slice(0.13f, Color.rgb(160, 165, 170), legend = "Legend E", label = "Last Label")
    )
    startAngle = -90
    isCenterLabelEnabled = true
    centerLabel = "Center label"
    centerLabelColor = Color.GRAY
    centerLabelIconTint = Color.rgb(159, 181, 114)
    legendsTitleColor = Color.MAGENTA
    legendsAlignment = Alignment.START
    centerLabelIcon = PieChart.DefaultIcons.SQUARE_HOLLOW
    legendTitleMargin = 14.dp
    legendsTitleSize = 16.sp
    labelIconsTint = Color.BLACK
    labelType = PieChart.LabelType.OUTSIDE
    isLegendsPercentageEnabled = false
    labelIconsPlacement = PieChart.IconPlacement.TOP
    gradientType = PieChart.GradientType.SWEEP
    holeRatio = 0.85f
}